This is what lands in your technician's hand. Not a spectrum to interpret — the
machine, the component, how urgent, how sure, and enough warning to schedule the
fix instead of reacting to it.
No line shutdown to install · On-premise available
Illustrative — example output
Alarm · ISO zone D2 min ago · pushed to Technician
P-114 · Feed Pump 3
Plant A · Line A · 30 kW centrifugal pump
Diagnosis
Outer-race bearing defect
Drive-end bearing · SKF 6309-2RS
18days of warning
0.91model confidence
9.6mm/s RMS zone D
Velocity trend · 18 daysISO 20816
Day 0lubricated day 9 — no responseDay 18
Inspect the drive-end bearing at the next scheduled stop.
BPFO band energy climbed through zone C to D over 18 days and did not respond to
lubrication — consistent with spalling, not a lubrication fault.
142
Assets monitored1 needs you today
Every plant has the machine everyone worries about.
The one that took the line down last spring, that nobody is quite sure about, that gets a nervous look on every walk-round. You are not monitoring that machine. You are hoping.
The failures that cost the most are almost never sudden. A bearing that seizes on a Tuesday has usually been telling you since the middle of last month — in a frequency band nobody was listening to.
3 senses
Vibration, temperature and shaft speed in one sealed unit
ISO 20816
Severity anchored to published velocity zones, not a private score
11 faults
Fault modes diagnosed by name, with the affected component identified
48 h
Raw waveform buffered on every sensor for forensic pull
The business case
What is unplanned downtime costing you?
Your numbers. Your arithmetic. Not someone else's ROI study.
Every vendor in this category will quote you a return figure from a commissioned study of a
model customer you have never met. We would rather hand you the calculator and let you put
your own plant into it.
Unplanned failures a year6
Average downtime per failure8 h
Cost of downtime per hourCA$12,000
Share caught early enough to act on60%
That last one is the honest variable. Not every failure gives warning — a seized
bearing from a lubrication error can go in hours. Rotating-equipment faults that develop
over days are what this platform is for, and you should set that share yourself rather
than let us set it for you.
This is arithmetic, not a promise. It multiplies four numbers you supplied and claims
nothing about what we will detect on your equipment. The only figure worth trusting is the one
measured against your own criteria at day 90 — which is exactly what the pilot is for.
One system, end to end
Sense. Transmit. Analyse. Act.
One vendor. One contract. No integration project.
No second product to buy to make the first one useful, and no integration project
standing between the sensor and the person who fixes the machine.
01 · On the asset
One sensor, three senses.
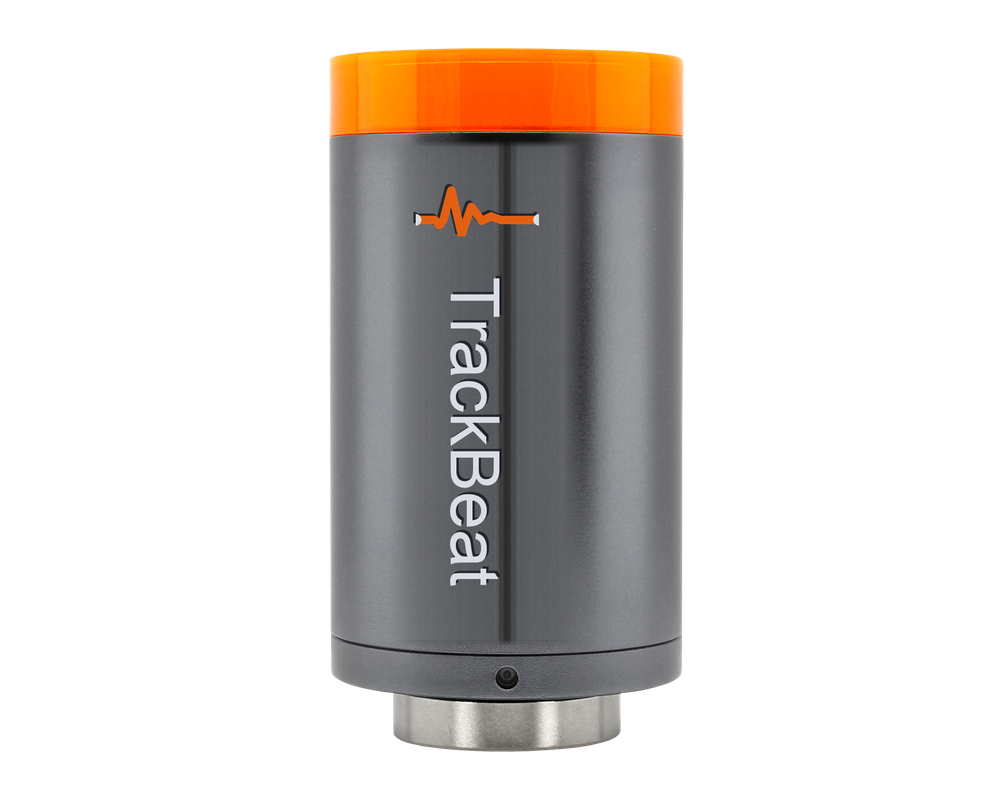
A sealed, battery-powered unit magnetically or stud-mounted on the bearing housing. Three
modalities in the same device, so a diagnosis has corroboration instead of one noisy channel.
Temperature — thermal confirmation and overheating
Magnetometer — shaft speed and running state
02 · In the cloud
The sensor measures. The cloud decides.
Doing DSP on the sensor protects battery life. Doing the diagnosis on the sensor
would freeze your fault model in firmware. We split it deliberately — so a model improvement
reaches every asset you own overnight, without a site visit.
A spectrum compared with the shaft speed measured on that machine
Band energy at the four bearing fault frequencies — outer race (BPFO), inner race (BPFI), rolling element (BSF) and cage (FTF) — plus sidebands
Self-learning baseline per asset, per load state
Bearing geometry resolved automatically from designation
Illustrative — example output
The hardware
Two things go on your floor.
One sensor. One receiver. Nothing else.
A sealed sensor on the machine and a rugged receiver on the wall. Nothing else — no wiring,
no panel space, no PLC tags.
Sensor
TrackBeat Sensor
Sealed, battery-powered, and mounted externally on the bearing housing. Three senses in
one unit so a diagnosis has corroboration rather than a single noisy channel.
Senses
Vibration · Temperature · Speed
Vibration
Triaxial, high-bandwidth
On-board
DSP + feature extraction
Raw buffer
48 h held on device
Mounting
Magnetic or stud, externalFitted in under a minute, on a running machine.
Power
Battery, reports state of charge
Receiver
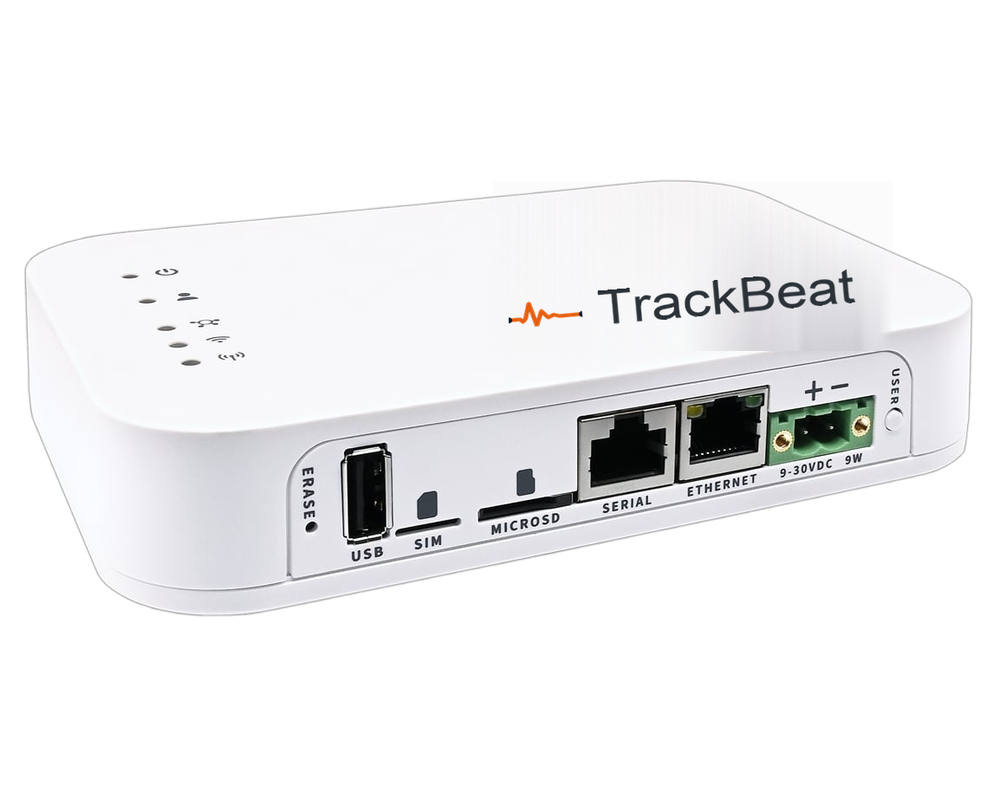
TrackBeat Receiver
The rugged edge box every sensor on site reports to. It runs a local dashboard, so the
floor keeps its visibility even when the WAN does not.
Tiers
Lite · Enterprise
Uplink
Wi-Fi or LTE, outbound only
Firewall
No inbound rules required
Local dashboard
Included, runs on deviceThe floor keeps its screens when the internet drops.
Sensor capacity
Sized at scoping
Typical per site
1–3 units
ShippingVibration + temperature
BatterySub-GHz
ShippingTemperature
BatterySub-GHz
ShippingReceiver — Enterprise
ACLocal dashboard
ShippingReceiver — Lite
ACLocal dashboard
Two boxes. Nothing wired, nothing cut into, nothing on your PLC.
One platform, thirty-four SKUs. Condition monitoring is where we started, not where the hardware stops. The same mainboard, radio modules and power stages carry temperature, runtime, tilt, level, environmental and control sensing across the full range. See the complete product line.
Diagnostic coverage
Exactly what we detect — and what we don’t.
Eleven fault modes. Two honest gaps.
Most vendors will tell you they detect “anomalies”. Your reliability engineer needs to know
which fault modes, sensed how, on which equipment. Bearing defects are read from the four
bearing fault frequencies. This is the whole list, including the gaps.
Fault mode
How it is detected
Equipment
Status
Outer-race defect
Vibration — band energy at BPFO + harmonics
Motors, pumps, fans, gearboxes
Detected
Inner-race defect
Vibration — BPFI + shaft-rate sidebands
Motors, pumps, fans, gearboxes
Detected
Rolling-element defect
Vibration — BSF + cage-rate modulation
Motors, pumps, fans, gearboxes
Detected
Cage / train defect
Vibration — FTF, sub-synchronous energy
Motors, pumps, fans, gearboxes
Detected
Imbalance
Vibration — dominant 1× radial, stable phase
All rotating equipment
Detected
Misalignment
Vibration — elevated 2× with axial component
Coupled drives
Detected
Mechanical looseness
Vibration — harmonic series, raised noise floor
All rotating equipment
Detected
Overheating
Temperature — absolute trend and rate of change
All rotating equipment
Detected
Cavitation
Vibration — broadband high-frequency energy
Pumps
Detected
Gear-mesh defect
Vibration — GMF + shaft-rate sidebands
Gearboxes
Detected
Unexpected stop / idling
Magnetometer — running state and shaft speed
All rotating equipment
Detected
Electrical faults rotor bar, eccentricity, demagnetisation
Requires stray-flux ESA — out of scope for the current magnetometer
Motors
Not yet
Lubrication starvation as a distinct diagnosis
Currently surfaces as a bearing-mode escalation, not its own class
All rotating equipment
Not yet
Three things we do that most platforms won’t.
Severity is anchored to published ISO 10816/20816 velocity zones — A, B, C, D — so your
engineer can audit our judgment against a standard instead of trusting a proprietary 0–100 health
score. Confidence is reported separately from severity, so a high-urgency, low-confidence call is
never disguised as a certainty. And the model is allowed to abstain: when a signature is out of
distribution we return unknown rather than inventing the nearest
familiar fault.
Eleven named faults, two published gaps, and a standard you can check us against.
One application. Four roles. No separate analyst tool.
One web application, four roles, no separate analyst tool. Asset-first by design — people come
in to look at a machine, so every alert links straight to the asset it came from.
Fleet
Every asset, worst first.
Grouped by the plant areas you define and sorted by what will actually stop production. An
asset inherits the worst severity of any sensor on it, so nothing hides behind an average.
One line each. An abstaining model is shown honestly as unknown and
routed to an engineer, rather than being quietly hidden or dressed up as a real fault.
Two boxes. One outbound connection. Nothing to open.
This is the part your IT group
reviews, and it is on this page rather than behind a sales call.
Network posture
Outbound only
The receiver opens a TLS connection out to our broker. No inbound rules, no port forwarding, no VPN to terminate.
OT network isolation
It sits on your IT or a dedicated segment. It never needs to talk to a PLC or a historian to function.
Survives a WAN outage
The on-site dashboard keeps serving locally, and each sensor holds 48 hours of raw waveform on-device.
On-premise option
The full platform can run inside your own network when residency or policy requires it. Same application, same roles.
The mesh does the hard part. Sensors reach the receiver over a long-range sub-GHz link
that carries through steel and concrete — so you are not running conduit to a bearing housing
or negotiating with the controls group for a PLC tag.
Your IT group has nothing to open and nothing to maintain.
Security, tenancy and governance
Live controls and commitments are listed apart.
A reviewer can send one URL. Nothing on that page is written in the present tense unless it is running in production.
TrackBeat is the condition-monitoring layer. It is not trying to replace your CMMS, your
historian or your ERP — it is trying to give them a reason to raise the right work order.
Documented API and live streams
The product API is HTTPS: an OpenAPI-described REST interface over assets, sensors, readings, insights and alerts — the same API our own application uses — plus a WebSocket feed for live readings. The receiver publishes to the platform over MQTT with TLS. Both paths are in use. No private endpoints.
Commissioning at scale
Over 1,100 shared equipment templates carry the right geometry, speed and bearing data the moment an asset is commissioned, with bearing fault frequencies resolved automatically from the designation. CSV import means a few hundred machines is a spreadsheet, not a fortnight of typing.
CMMS & historian connectors
RoadmapTurnkey connectors are in development. Today the documented API supports the same integration, built by you or by us during onboarding.
Rollout
From purchase order to a diagnosis you trust, in about 90 days.
Week zero to day ninety.
Condition monitoring has to learn your machines before it can judge them. We would rather set
that expectation now than promise insight on day one and lose your confidence in week three.
Week 0
Scope one line
We pick a line together, list its assets by criticality, and agree in writing what success looks like — faults caught, at what lead time, at what false-alarm rate.
Week 1
Install
Sensors mount externally on bearing housings; the receiver goes on a wall. No shutdown, no wiring, no controls work. Your technician commissions each sensor in the app.
Weeks 2–4
Learn baseline
The platform observes each asset across its real duty cycle — every shift, load state and changeover — to learn what normal looks like on your floor, not on a test rig.
Weeks 4–8
Diagnose & tune
Insights start firing. Technicians log what they found when they opened the machine, and each label feeds retraining. This is where the false-alarm rate drops.
Weeks 8–12
Review honestly
We measure against the week-zero document: what we caught, how early, what we missed, what we called wrong. That evidence drives the plant-wide rollout decision.
From purchase order to a diagnosis you have personally verified.
Commercial model
Hardware once. Software per monitored asset. Users are free.
Quoted against your asset list, not your headcount.
We do not charge per seat, because a monitoring platform only works when the whole plant is
looking at the same screen. Pricing is quoted against your asset list.
Step one
Pilot
One production line, fixed scope, fixed price, and a written success definition agreed before we start.
Live readings and running-state data are available from day one. Diagnosis needs a baseline, which takes roughly two to four weeks of real duty cycle. Any vendor promising a trustworthy fault call on day one is showing you a generic model that has never seen your machines.
What about false alarms? We’ve been burned before.
This is the failure mode that kills condition-monitoring programmes. Severity and confidence are separate fields, so a low-confidence call is never dressed up as certainty. Every outcome your technician logs is kept, so alerts get sharper over the first few months rather than staying noisy.
Do we need a reliability engineer on staff to use it?
No. The output is a plain-language diagnosis — failure type, affected component, severity, confidence, recommended action — aimed at a maintenance technician, not a vibration analyst. If you do have an analyst, the full spectrum, fault-frequency overlays and contributing features are there for them to audit every call we make.
Will this replace our CMMS?
No, and it shouldn’t. TrackBeat is the condition-monitoring layer that tells your CMMS which work order deserves to exist. Turnkey connectors are on the roadmap; today the documented API supports that integration, and we will help build it during onboarding.
What about hazardous areas, and battery life?
Tell us your area classification during scoping and we will tell you honestly whether we can serve it today — we would rather lose a zone than sell you hardware that shouldn’t be there. On battery: sensors carry on-board fuel gauging that reports state of charge to the platform, and we size expected life against your sampling cadence at scoping rather than quoting a marketing number.
Next step
Put it on one line. Judge us at day 90.
Bring your worst-behaving production line. We will scope it, install it, agree the success criteria in writing before we start, and review the results against them honestly — including what we got wrong.