Fleet
Every site, area, and machine on one map. Each site card shows its worst state, so the day starts where attention is needed.
Not a spectrum to interpret. The machine, the component, how urgent, and how sure, with enough warning to schedule the fix instead of reacting to it.
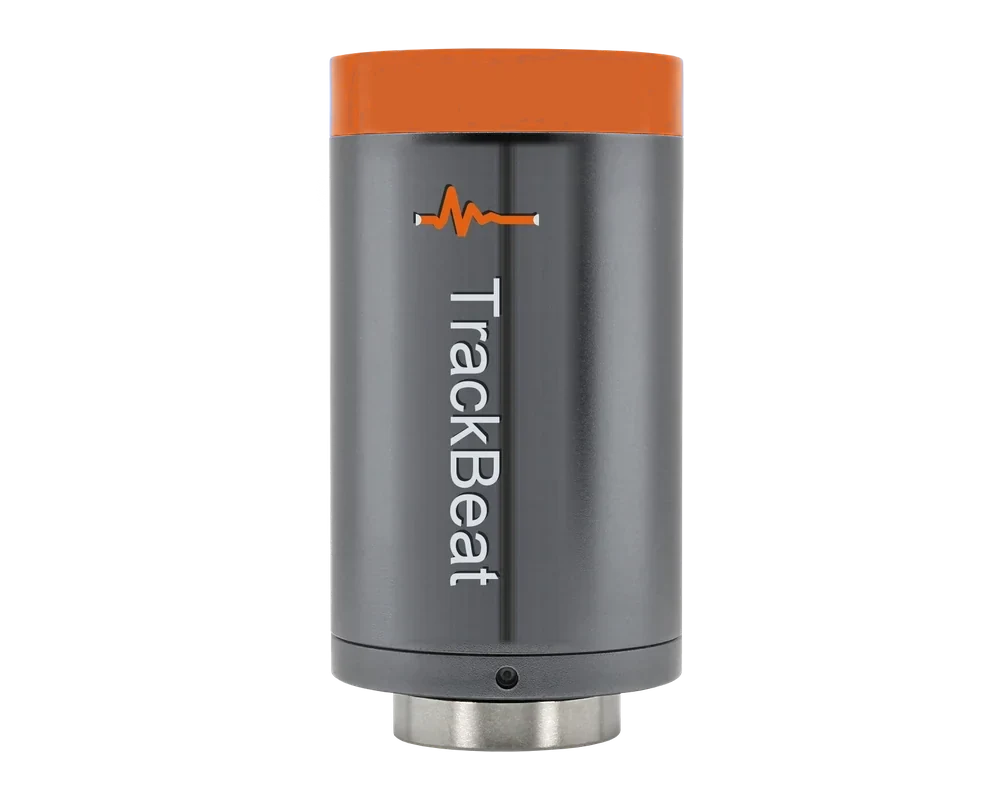
Four things you can check on your own line.
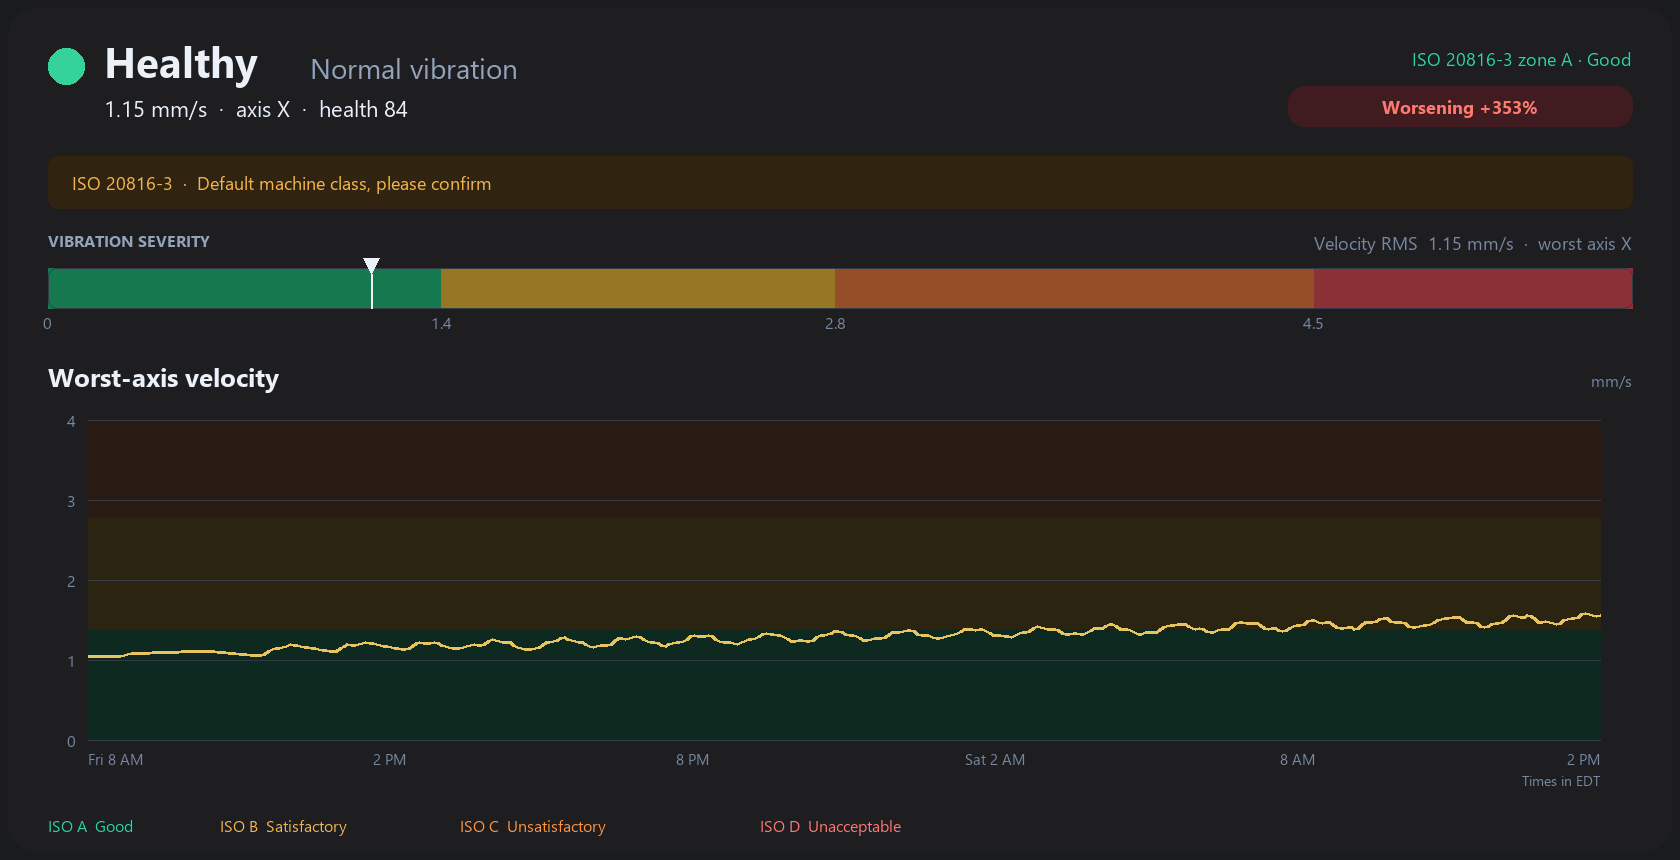
Each machine opens on its state: healthy, warning, or alarm, with the axis and the ISO zone beside it. The spectrum is one tab away for the engineer who wants it.
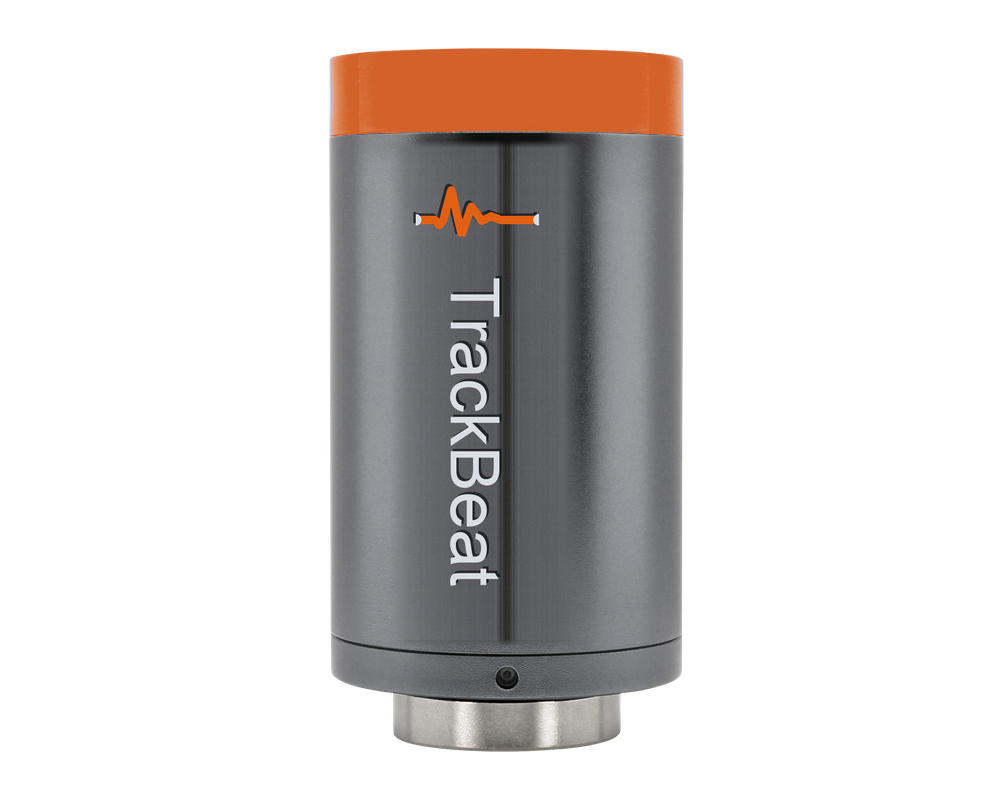
Triaxial vibration, temperature, and a magnetometer for shaft speed. A diagnosis has more than one channel to stand on, and the magnetometer tells a stopped machine from a running one.
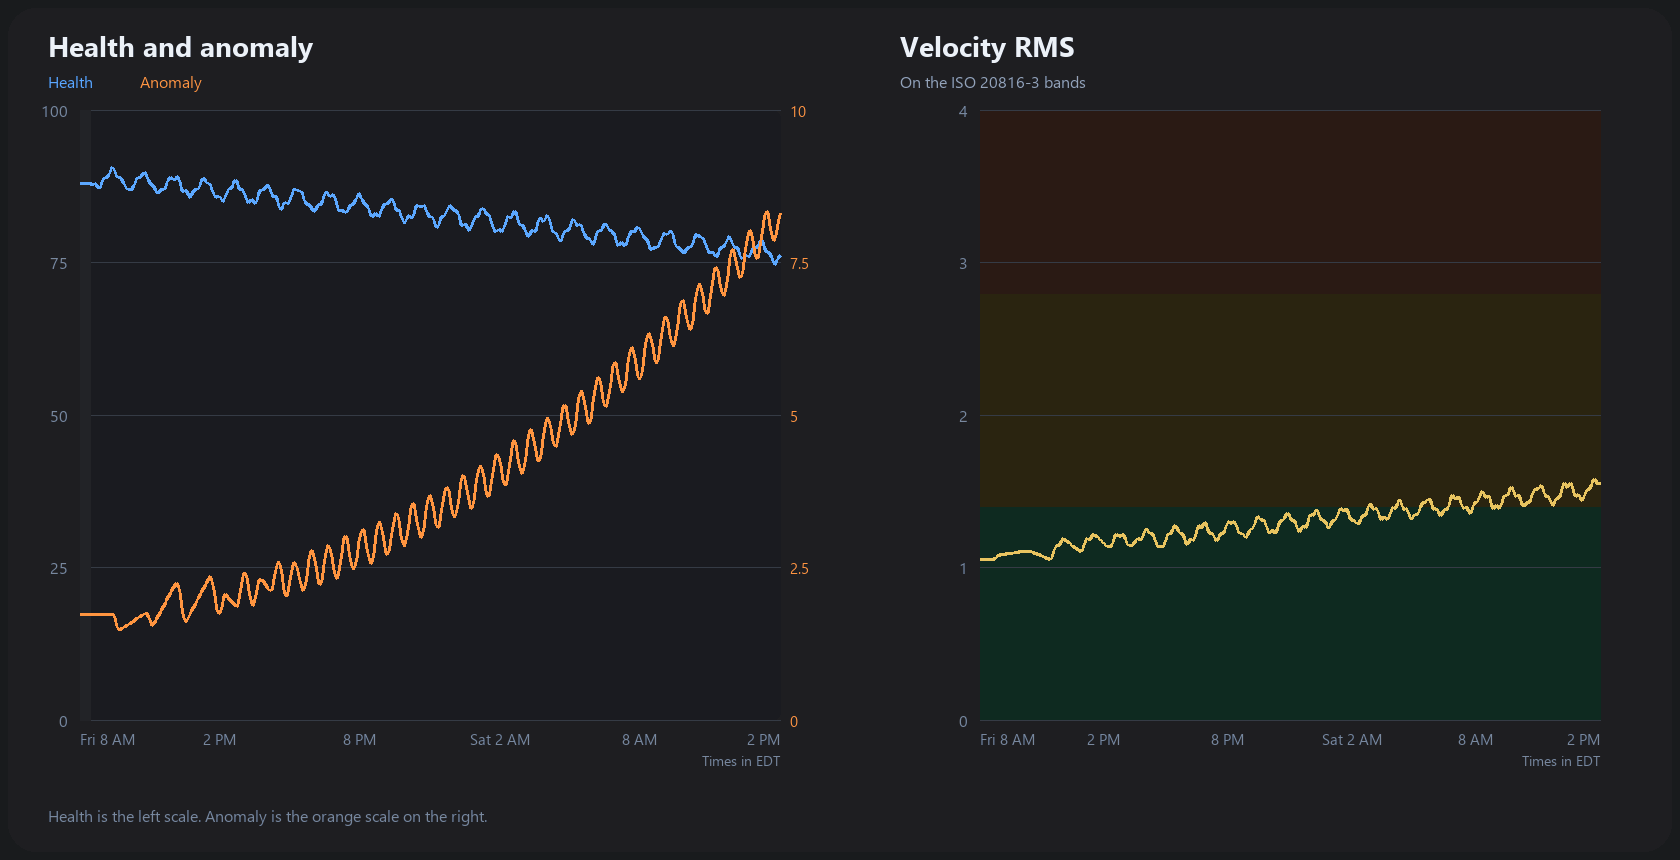
Velocity RMS is plotted on the ISO 20816-3 bands for that machine class. Beside it sits an anomaly score, measured against the baseline learned on your floor.
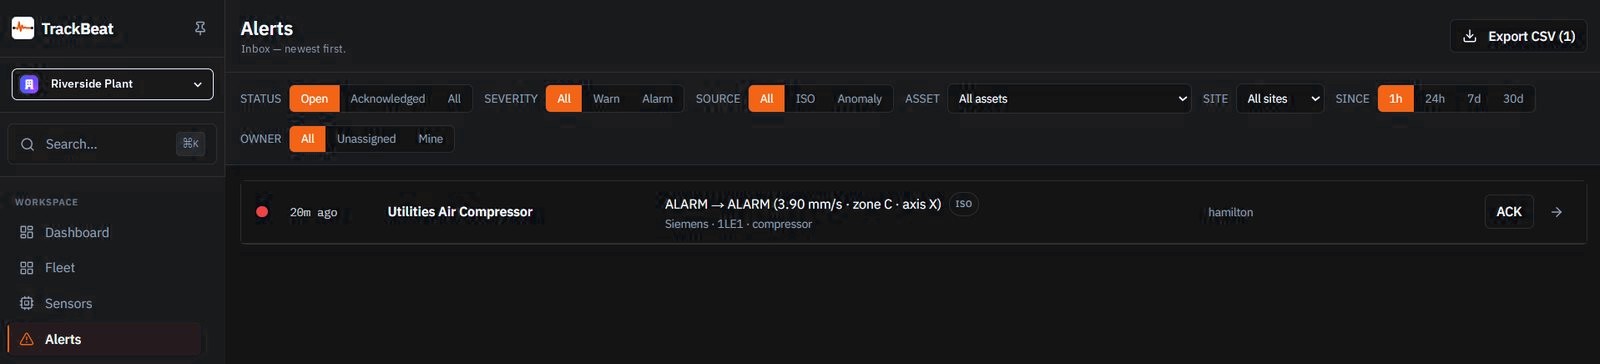
One inbox. Filter by severity, source, asset, site, and owner. Acknowledge from the row, and export the list for the shift report or your CMMS.
Four steps, from the bearing housing to the alert.
Eleven fault modes. Two honest gaps. The coverage list shows how each one is detected.
The same readings feed the screens your team opens every morning.
Every site, area, and machine on one map. Each site card shows its worst state, so the day starts where attention is needed.
Health, anomaly, velocity, temperature, and kurtosis for each asset, on the ISO bands for its machine class.
Warnings and alarms in one inbox, with acknowledgement and CSV export.
Figures not on this list are not claimed. The specifications page is the sheet a reliability engineer can size from.